Tolerance stack-up analysis calculates how dimensional variations from multiple parts combine to affect the fit and function of an assembly. Even when every CNC-machined component meets its individual drawing tolerance, the assembled product may still have excessive clearance, unwanted interference, or alignment problems.
Two common calculation methods are Worst-Case Analysis, which evaluates the extreme possible dimensional combinations, and Root Sum Square (RSS) Analysis, which estimates variation statistically.
This guide explains both methods, provides the formulas, and walks through a practical CNC assembly example to help engineers evaluate tolerances before manufacturing.
What Is Tolerance Stack-Up Analysis?
Tolerance stack-up, also called tolerance accumulation, describes the combined effect of dimensional variations within an assembly.
Every manufactured component has allowable dimensional variation. When multiple components are assembled, these variations can add together or cancel each other, depending on the direction of the dimensions.
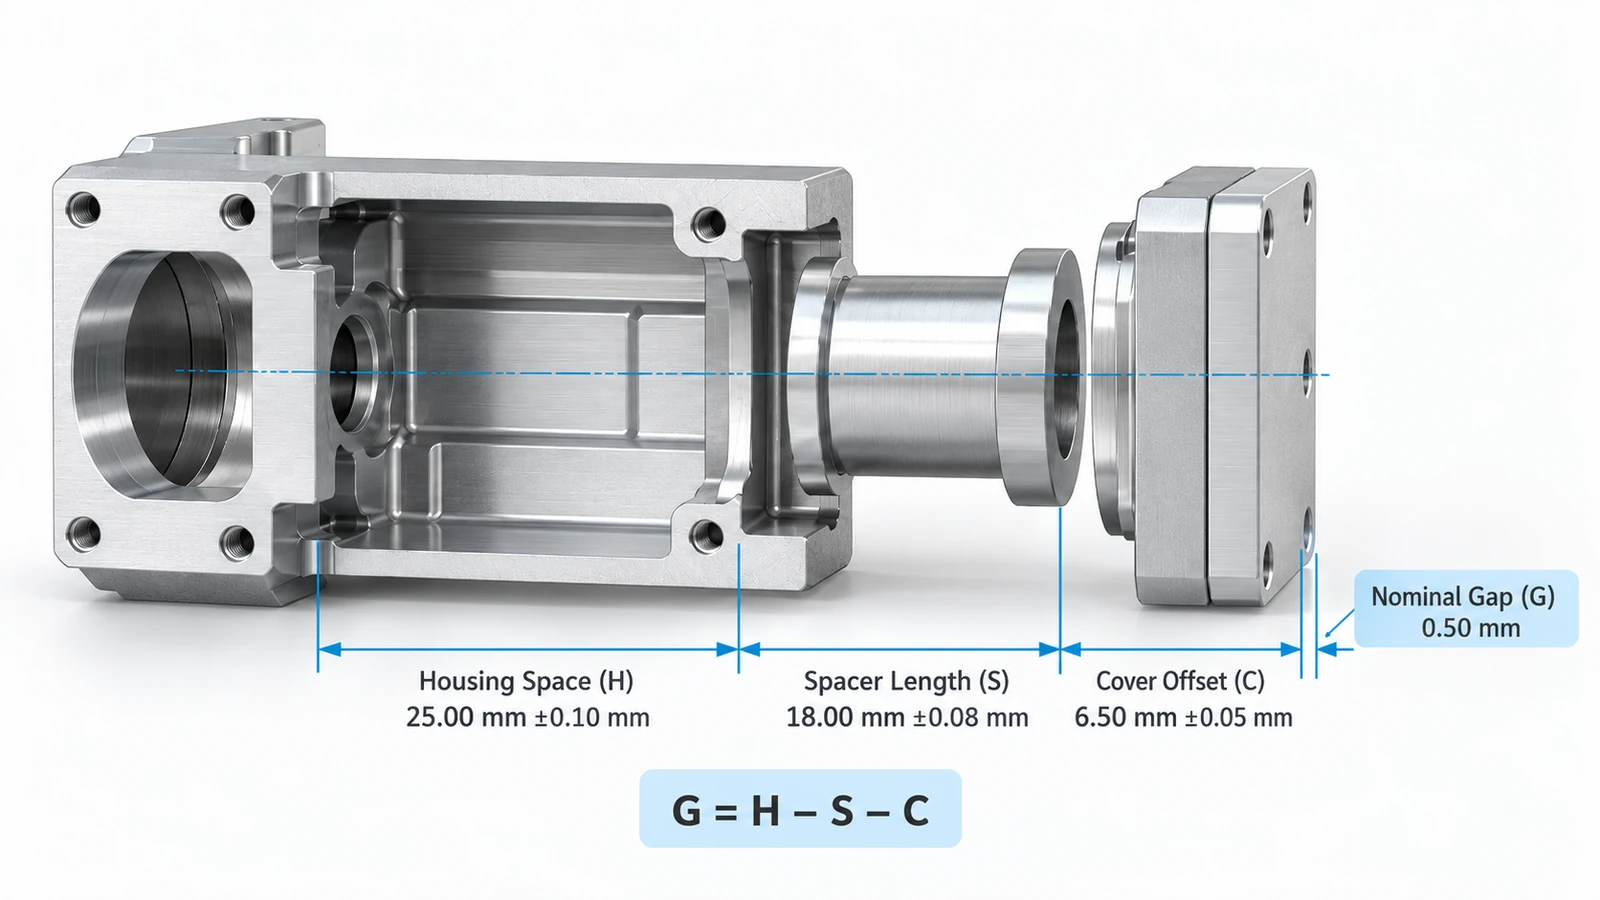
For example, consider an aluminum housing containing a spacer and a cover.
The housing provides an internal axial space, while the spacer and cover occupy part of that space. The remaining clearance depends on all three dimensions.
If the housing is manufactured near its minimum size while the spacer and cover are near their maximum sizes, the final gap becomes smaller.
The opposite combination creates a larger gap.
Tolerance stack-up analysis helps engineers determine whether both conditions remain acceptable.
It is particularly useful for CNC-machined housings, shaft assemblies, bearing arrangements, precision fixtures, and other components where multiple dimensions affect one functional requirement.
How to Calculate Tolerance Stack-Up
Before choosing a calculation method, identify the functional dimension and establish the dimensional chain that controls it.
Step 1: Define the Functional Requirement
Start with the assembly condition that matters.
This could be:
- Minimum clearance between components.
- Maximum allowable axial movement.
- Required engagement or insertion depth.
- Position of a functional surface.
- Prevention of interference between mating parts.
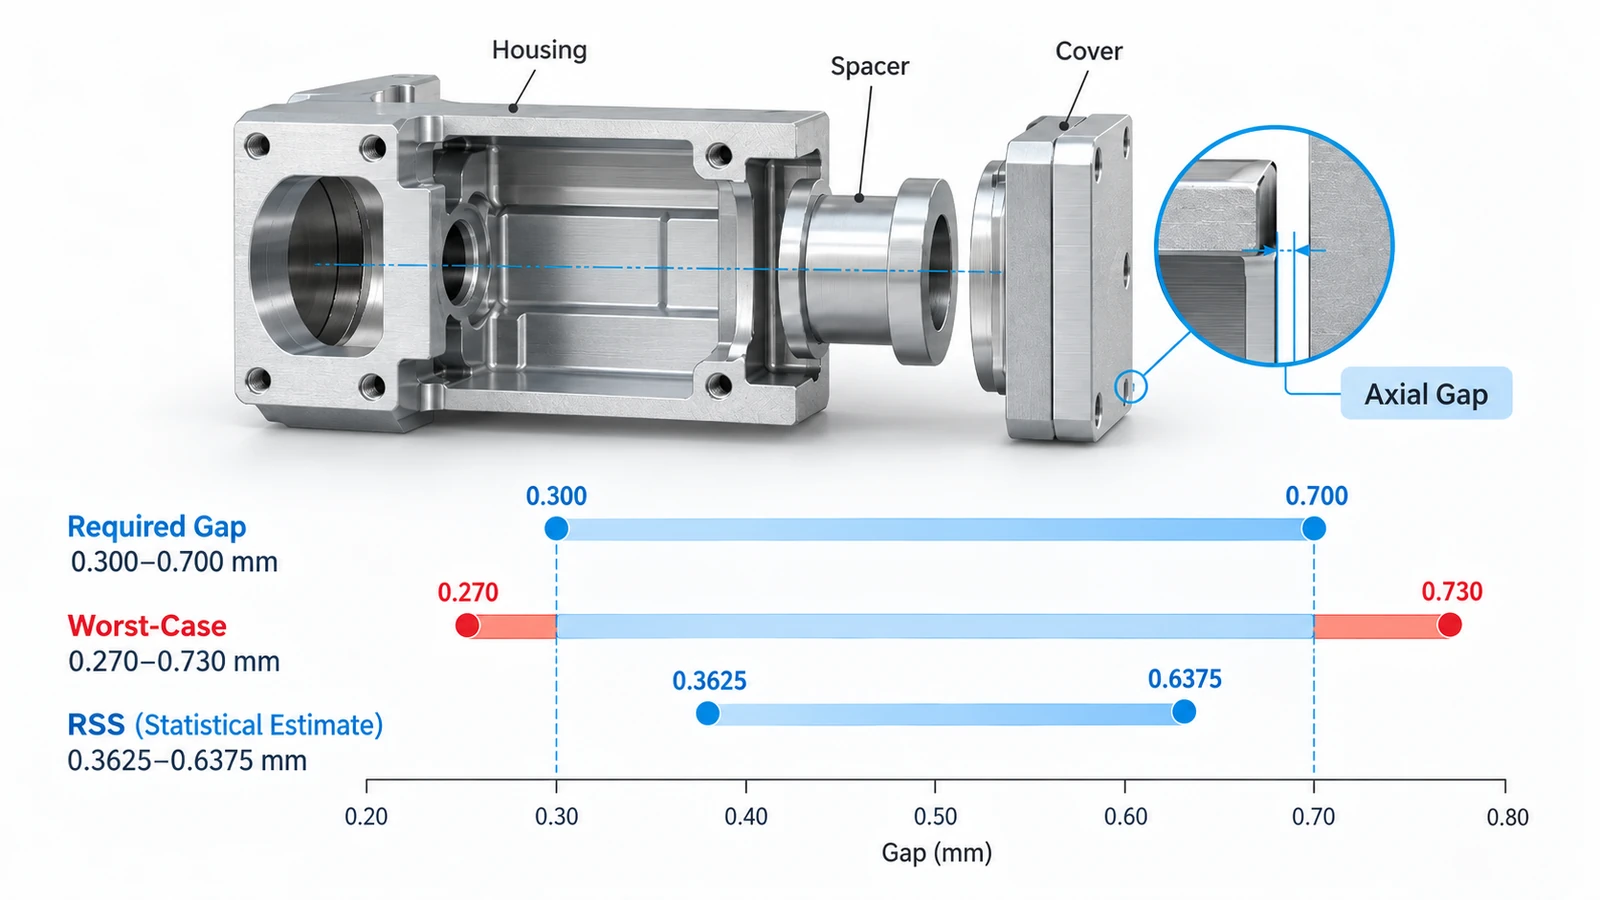
For example, an assembly may require an axial gap between 0.30 mm and 0.70 mm.
This becomes the acceptance range against which the calculated stack-up will be evaluated.
Step 2: Build the Dimension Chain
Identify every dimension that directly contributes to the functional requirement.
For a simple one-dimensional assembly:
Gap = Housing Space − Spacer Length − Cover Offset
Or:
G = H − S − C
Where:
- G = final assembly gap
- H = available housing space
- S = spacer length
- C = cover offset
Dimensions that increase the gap have positive contributions, while dimensions that reduce it have negative contributions.
The complete chain must close between the functional reference surfaces.
Step 3: Record Nominal Dimensions and Tolerances
List each contributor with its nominal dimension and specified limits.
For symmetric tolerances, the nominal value and ± tolerance are sufficient for a preliminary calculation.
For asymmetric tolerances, use the actual upper and lower limits rather than assuming the tolerance is centered.
Step 4: Calculate and Evaluate
Calculate the nominal functional dimension, then use Worst-Case or RSS analysis to evaluate dimensional variation.
Finally, compare the results with the required assembly limits.
For complex three-dimensional assemblies, geometric tolerances, datum relationships, and assembly constraints may require more advanced analysis.
Worst-Case Tolerance Stack-Up
Worst-Case Analysis calculates the maximum possible assembly variation when every contributing dimension reaches its most unfavorable permitted limit.
For a one-dimensional chain with independent dimensional bounds and symmetric tolerances, the total worst-case tolerance is:
TWC = |T1| + |T2| + ⋯ + |Tn|
The signs of the dimensions determine the nominal result. The absolute tolerance contributions are added to determine the maximum variation.
Worst-Case Calculation Example
Suppose three dimensions have the following tolerances:
- Housing: ±0.10 mm
- Spacer: ±0.08 mm
- Cover: ±0.05 mm
The combined worst-case tolerance is:
TWC = 0.10 + 0.08 + 0.05 = 0.23 mm
If the nominal assembly gap is 0.50 mm, the possible range is:
Gmin = 0.50 − 0.23 = 0.27 mm
Gmax = 0.50 + 0.23 = 0.73 mm
The resulting gap can therefore range from 0.27 mm to 0.73 mm.
When Should You Use Worst-Case Analysis?
Worst-case analysis is appropriate when every permitted combination of conforming parts must satisfy the assembly requirement.
It is especially useful for:
- Safety-critical or function-critical dimensions.
- Low-volume assemblies with limited process data.
- Components that cannot be adjusted after assembly.
- Designs where interference could cause damage.
- Applications requiring deterministic acceptance limits.
Its main disadvantage is that it may lead to tighter individual tolerances and higher manufacturing costs.
However, if the worst-case range satisfies the functional specification, the dimensional chain passes for all contributors within their stated limits, assuming the chain model includes all relevant effects.
RSS Tolerance Stack-Up
Root Sum Square (RSS) is a statistical method used to estimate how independent dimensional variations combine in an assembly.
Instead of adding every tolerance arithmetically, RSS combines their squared contributions.
For symmetric tolerance values:
TRSS = √(T12 + T22 + ⋯ + Tn2)
For the same three dimensions:
TRSS = √(0.102 + 0.082 + 0.052)
TRSS = √0.0189 ≈ 0.1375 mm
The estimated assembly range becomes:
G = 0.50 ± 0.1375 mm
Or approximately:
0.3625–0.6375 mm
This range is narrower than the worst-case result because the RSS method does not assume that every dimension simultaneously reaches its most unfavorable limit.
Important RSS Assumptions
RSS calculations require more than the nominal drawing tolerances.
A statistical interpretation generally assumes that dimensional contributors are independent and that their variation is understood.
If each input tolerance represents the same statistical coverage level, such as ±3 standard deviations for a centered normal process, the combined RSS tolerance represents that same coverage level for the resulting linear stack.
In practice, engineers should consider:
- Whether the processes are centered on their expected values.
- Whether variation is approximately normal or otherwise characterized.
- Whether dimensions are statistically independent.
- Whether the input tolerances use consistent statistical coverage assumptions.
- Whether the manufacturing process remains stable.
If dimensions are correlated, their covariance must be included. A simple RSS calculation may underestimate the actual assembly variation.
RSS is not a guaranteed dimensional boundary. A result within the design limits does not automatically prove that every assembly will pass or establish a reliable production yield.
Worst-Case vs RSS: Key Differences
Both methods can be useful, but they answer different engineering questions.
| Feature | Worst-Case Analysis | RSS Analysis |
|---|---|---|
| Calculation | Arithmetic sum of tolerance contributions | Square root of summed squares |
| Main purpose | Determine extreme possible dimensional limits | Estimate statistical assembly variation |
| Statistical assumptions | Not required | Required for statistical interpretation |
| Result | Deterministic dimensional bounds | Statistical estimate |
| Guaranteed fit | If the calculated range fully meets requirements | No universal guarantee |
| Typical use | Critical fits and limited process data | Stable, characterized production processes |
| Main drawback | May encourage costly tight tolerances | Sensitive to incorrect statistical assumptions |
Which Method Is Better?
Neither method is universally better.
Worst-case analysis is appropriate when the design must function for every allowed dimensional combination.
RSS may be useful when manufacturing variation is well characterized and a quantified level of assembly risk is acceptable.
For production decisions, engineers should consider both the functional consequences of failure and the actual process capability of the suppliers.
Some assemblies require a combination of deterministic limits, statistical evaluation, inspection, and controlled adjustment.
Tolerance Stack-Up Calculation Example
Consider a CNC-machined aluminum housing containing a precision spacer and a cover feature.
The assembly requires a controlled axial clearance between the spacer and the cover’s internal reference surface.
The required finished gap is:
0.30–0.70 mm
Assembly Dimensions
| Dimension | Nominal Size | Tolerance |
|---|---|---|
| Housing Space (H) | 25.00 mm | ±0.10 mm |
| Spacer Length (S) | 18.00 mm | ±0.08 mm |
| Cover Offset (C) | 6.50 mm | ±0.05 mm |
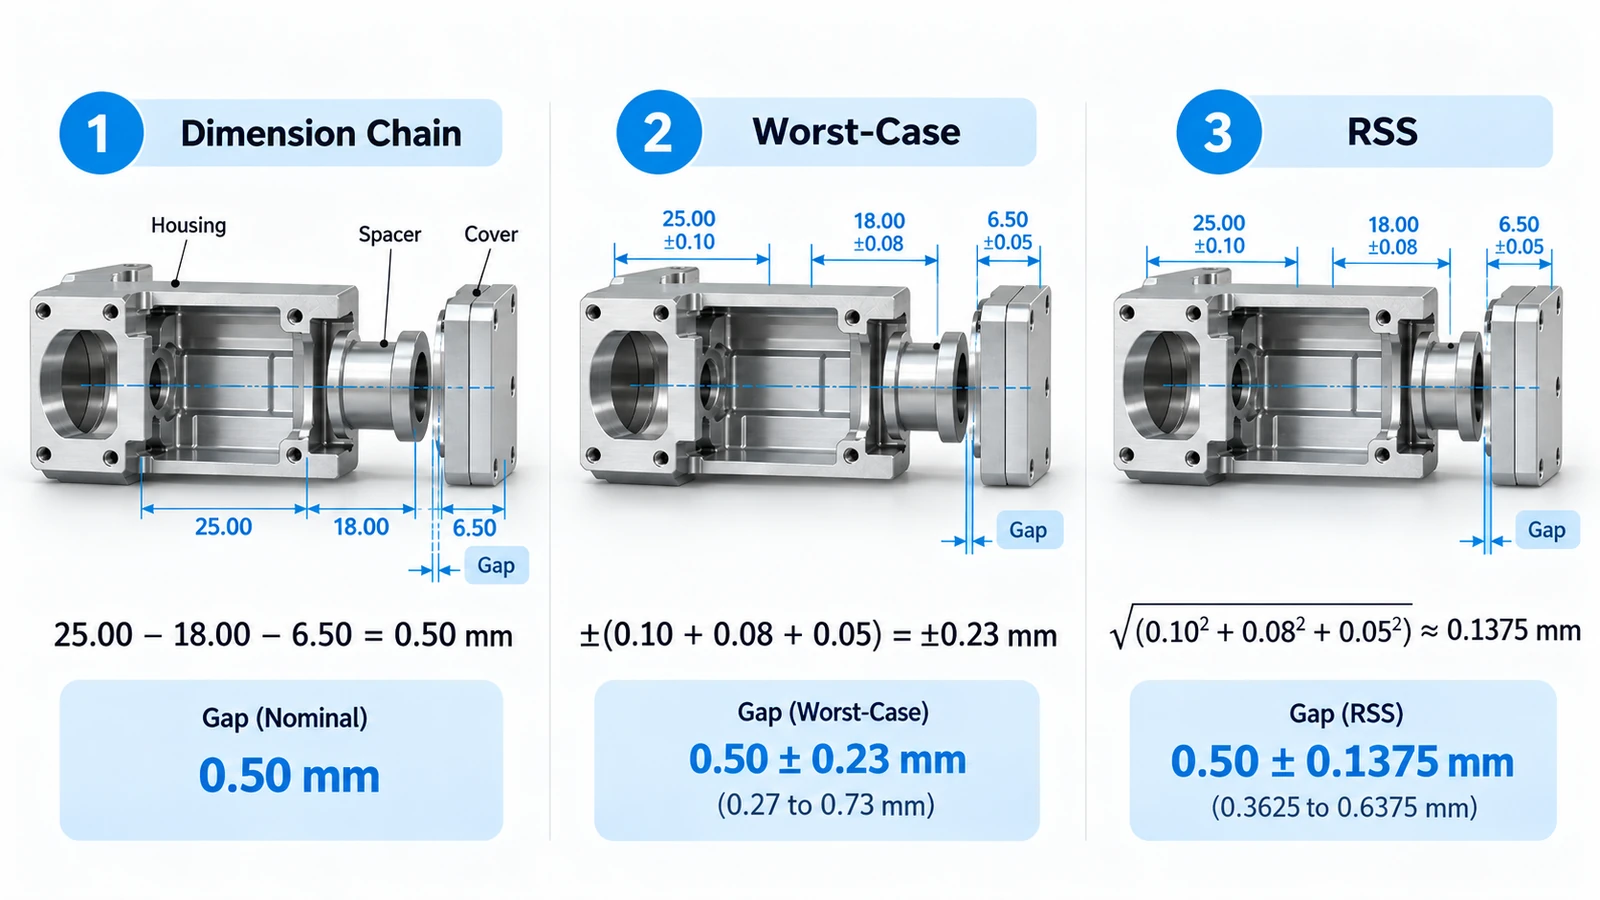
The functional dimension chain is:
G = H − S − C
1. Calculate the Nominal Gap
G = 25.00 − 18.00 − 6.50
G = 0.50 mm
The nominal gap satisfies the 0.30–0.70 mm requirement.
However, nominal dimensions alone cannot confirm whether the tolerance design is acceptable.
2. Calculate the Worst-Case Gap
The minimum gap occurs when the housing space is smallest and both contributing component dimensions are largest.
Gmin = 24.90 − 18.08 − 6.55
Gmin = 0.27 mm
The maximum gap occurs with the opposite dimensional combination:
Gmax = 25.10 − 17.92 − 6.45
Gmax = 0.73 mm
Worst-Case Result: 0.27–0.73 mm
This exceeds the allowable range at both ends.
Therefore, the design does not satisfy the worst-case requirement.
3. Calculate the RSS Result
Using the same tolerance contributions:
TRSS = √(0.102 + 0.082 + 0.052)
TRSS ≈ 0.1375 mm
Therefore:
G = 0.50 ± 0.1375 mm
RSS Result: approximately 0.3625–0.6375 mm
Under the stated statistical assumptions, this predicted interval lies within the required gap limits.
However, this does not eliminate the possibility of assemblies falling outside those limits.
4. Compare the Results
| Result | Worst-Case | RSS |
|---|---|---|
| Nominal gap | 0.500 mm | 0.500 mm |
| Combined tolerance | ±0.230 mm | Approximately ±0.1375 mm |
| Calculated range | 0.270–0.730 mm | Approximately 0.3625–0.6375 mm |
| Fits inside required range | No | Predicted interval does |
| Guaranteed for all conforming parts | No | No |
The important conclusion is that the same component tolerances can lead to different engineering decisions depending on the evaluation method and acceptable assembly risk.
Before approving a design based on RSS, the relevant process variation and statistical assumptions should be verified.
How to Reduce Tolerance Stack-Up in CNC Assemblies
Tolerance stack-up problems should not automatically be solved by tightening every component tolerance.
A better approach is to identify which dimensions control the functional requirement and improve the design or manufacturing process accordingly.
1. Reduce the Number of Contributing Dimensions
Every additional independent dimension in a stack can increase the potential variation.
Where practical, simplify the assembly or reference critical dimensions directly from functional surfaces.
For example, combining two nonessential spacer features may reduce the number of dimensional contributors.
Any redesign must still satisfy manufacturing, maintenance, and functional requirements.
2. Use Functional Datums
Appropriate datums help relate critical features to the surfaces that control assembly function.
A CNC-machined housing may benefit from dimensioning important internal features from a common mounting or locating surface.
A consistent datum strategy can also improve machining setup planning and inspection.
However, simply changing the drawing’s datum labels does not physically remove variation. The design and manufacturing process must use the datum relationships effectively.
3. Tighten Only Critical Tolerances
Not every dimension contributes equally to the functional gap.
Engineers should identify the dimensions with the greatest impact on the final result.
For example, reducing the housing tolerance in the earlier assembly from ±0.10 mm to ±0.05 mm changes the worst-case combined tolerance to:
TWC = 0.05 + 0.08 + 0.05 = 0.18 mm
The resulting gap becomes:
0.32–0.68 mm
This satisfies the required 0.30–0.70 mm range in the simplified one-dimensional model.
Only one tolerance was changed.
This is a more targeted solution than tightening every component unnecessarily.

4. Adjust Nominal Dimensions When Appropriate
Sometimes the nominal dimensions can be modified to improve functional clearance or interference conditions.
However, shifting the nominal gap does not reduce the total tolerance range.
If a symmetric requirement is already centered on the nominal gap, reducing the stack variation is usually necessary to satisfy both upper and lower limits.
Any nominal adjustment should be checked against the complete assembly requirements.
5. Consider Shims or Selective Assembly
For assemblies that allow adjustment, precision shims or selective component matching may compensate for dimensional variation.
These approaches can be useful in certain mechanical and equipment assemblies.
However, they add assembly operations, inspection requirements, and inventory complexity.
The final choice should balance production quantity, serviceability, functional requirements, and total manufacturing cost.
Conclusion
Tolerance stack-up analysis helps engineers predict how dimensional variation affects an assembled product.
Worst-case analysis evaluates the extreme permissible combinations, while RSS provides a statistical estimate under appropriate assumptions.
By building a correct dimension chain, calculating both methods, and evaluating the resulting assembly requirements, designers can identify potential fit problems before production.
The most effective improvements often come from simplifying the dimensional chain, controlling functional datums, and tightening only the tolerances that matter.
Need precision CNC-machined components with critical assembly tolerances?
YUANYI provides custom CNC milling, turning, and manufacturability review services for metal and engineering plastic parts. Share your CAD files or engineering drawings to discuss your project requirements and request a quotation.
Frequently Asked Questions
Not every individual component requires a formal stack-up study. It is most valuable when several toleranced dimensions influence a critical assembly requirement, such as clearance, alignment, or engagement.
Yes. Geometric tolerances such as position, orientation, and profile may affect assembly variation. Their contribution depends on the feature geometry, datum system, and functional requirement. Complex cases may need two- or three-dimensional analysis.
Use the actual upper and lower dimensional limits for worst-case calculations. For statistical analysis, account for the expected process mean and variation rather than treating asymmetric limits as automatically centered.
Monte Carlo simulation can evaluate more complex distributions, nonlinear relationships, and correlated variables when modeled correctly. However, it still depends on the accuracy of the input distributions and assumptions.
Manufacturers can review critical dimensions, machining setups, datum relationships, achievable tolerances, and inspection methods. Early manufacturability feedback can help identify unnecessary precision requirements and potential assembly problems.